Is it the occupation that dictates party affiliation or vice versa?

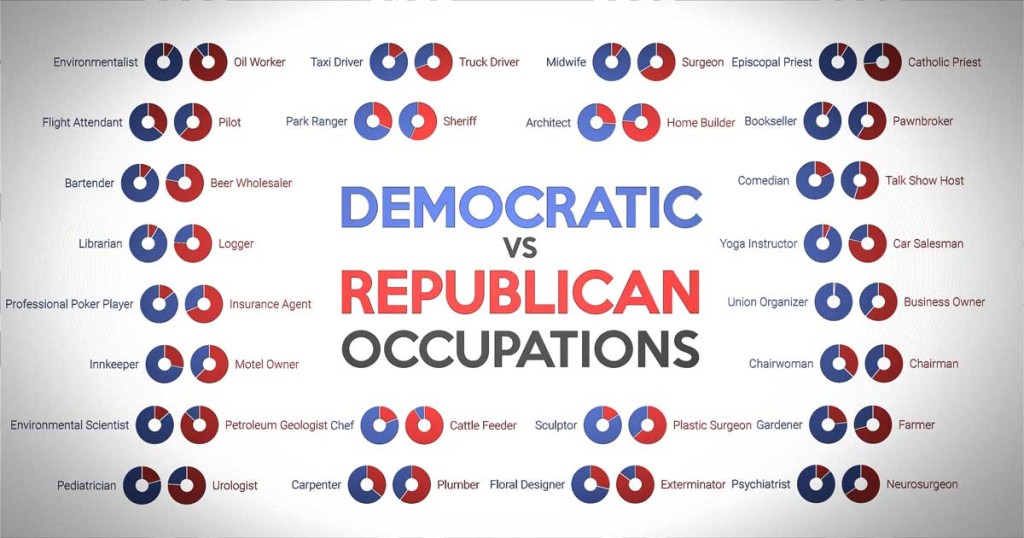
Verdant Labs just recently posted a chart that is able to tell the likelihood of someone being a Republican or a Democrat based on their profession. How are they able to determine this? They use Federal Election Commission (FEC) data. When one donates, one usually provides in addition the amount contributed, one’s occupation and other information. They extrapolate that data to the public at large.
According to Verdant Labs, there is a caveat.
A caveat with this methodology is that we assume Democrats and Republicans contribute at a similar rate to each other within each profession. In other words, we assume that a 75 / 25 split of contributions by Democratic teachers vs. Republican teachers translates to a 75 / 25 split of Democrat vs. Republican teachers in the general populace. If it’s actually the case that, say, Republican teachers are looser with their wallets and have a higher per capita contribution rate, our ratio for that profession will be a bit skewed. Thus, the ratios should be viewed as approximate.
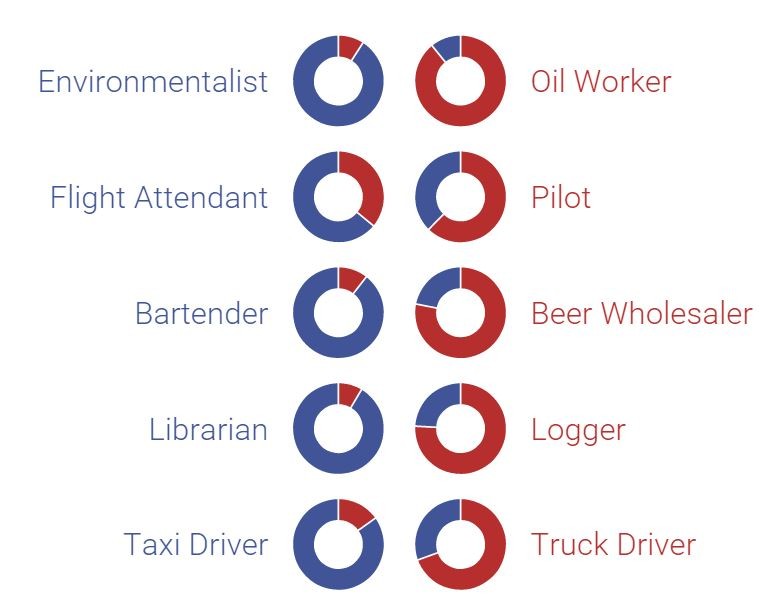
There are some professions where it would be easy to discern whether they would lean Republican or lean Democratic. Truck drivers lean Republican by a large margin while taxi drivers lean Democratic by a large margin. Why? Because truck drivers are likely their trucks listening to Right Wing radio. Taxi drivers are generally from cities and more urban. They come in contact with a lot of people from all over and as such expand their horizons.
Oil workers lean heavily Republican while environmentalists lean heavily Democratic. Oil workers likely frown on regulations that would curtail employment in that sector. Environmentalists believe in climate change. That stance makes them anathema to the Republican Party.
There was one that baffled the mind. Carpenters lean Democratic by large margin. Plumbers lean Republican by a large margin though not as large. Why? Anyone has a clue?
Democratic vs. Republican
occupations
Most librarians are Democrats. Most farmers are Republicans.
As a group, doctors are in the middle, though pediatricians lean left and urologists right.
Below: Ratios of Democrats (blue) vs. Republicans (red).
Data source: Campaign contribution data from the FEC.
Design and engineering by Verdant Labs,
creators of the Nametrix baby name research app
The entire chart can be found here.

