


Editor’s Note: This piece was sent by a Republican who wanted this information out on COVID-19 and his party. He says: “I weep for my party.“
by Matt Yemma
As a lifelong Republican, and a believer in an individual’s rights, free enterprise, science, and the power of data, it pains me deeply to write this. But as we – and others, such as the members of the European Community – watch the progress of the COVID-19 pandemic in the U.S. with increasing alarm, it begs the question: What are our Republican government officials thinking? And of course the question begs, yes, yet another COVID-19 graph.
The following graph charts the progress of the pandemic state-by-state over the last twelve weeks. States won by Donald Trump are shown in red and by Hilary Clinton in blue. The intensity of the color depends on whether the candidate’s plurality was less than 5%, between 5% and 15%, or greater than 15%. To even the playing field for the 33 states graphed (see below for selection criteria), we’ll look at weekly new cases per 1MM population, with the thickness of each state’s curve roughly in proportion to its population:

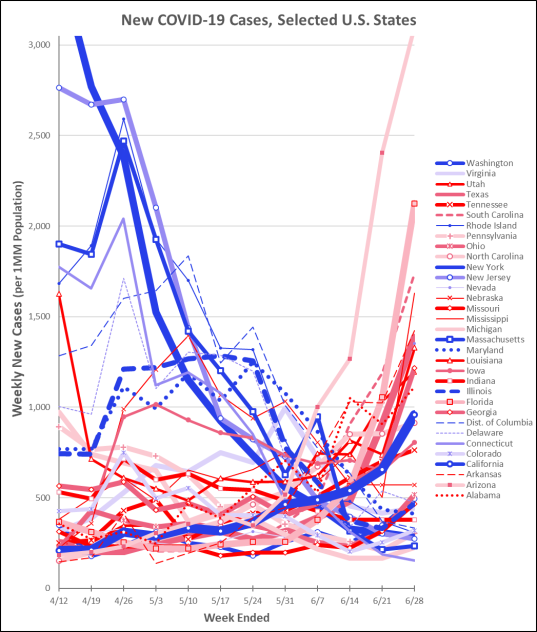
A clear pattern has emerged, helped by the color coding. In the early stages of the pandemic, a small but populous group of states were hit the hardest. Virtually all of these states are in the Northeast or the industrial Midwest, and most were heavily blue states in 2016. Then, from mid-April to mid-May, virtually every hard-hit state saw declines in new cases, and those with low numbers stayed low.
In late May – around the time of Memorial Day and the general reopening of the economy – the epidemiologists began warning of an upcoming surge in cases, and lo and behold, that’s what happened. At least that’s what happened in the red states, while most blue states stayed flat or continued to see a decline. To attribute the surge to more testing, or to dismiss the surge because it’s now mostly affecting a younger class of people, is intellectually dishonest. And the claim that the surge of this magnitude was “expected” as the economy reopened, well, that’s a little like a clumsy person who trips and falls, and then says, “I meant to do that.”
(I note that the one blue state that’s seen a dramatic and steady recent increase is California. As a longtime resident of Silicon Valley, I can only attribute the increase to the wackos in Southern California. And on a more positive note for the red states, a couple deserve accolades: Indiana for keeping new cases at a steady low level, and Nebraska for bringing an alarming increase in mid-May under control.)The evidence is overwhelming. Blue states seem to have learned from the first weeks of the pandemic, and red states haven’t. I weep for my party.
NOTE: To make the graph a little less of a visual challenge, only states that fell into one of the following three groups are graphed:
- The twenty states with the largest population
- The fifteen states with the most total COVID-19 cases per capita as of April 12
- The fifteen states with the most new cases per capita during the week ending June 28
Because of overlap, only 33 states were graphed. Only one state – Georgia – met all three criteria. And only one other less populous state – Louisiana – met both criteria (2) and (3); many attribute Louisiana’s early outbreak to the Mardi Gras celebration.